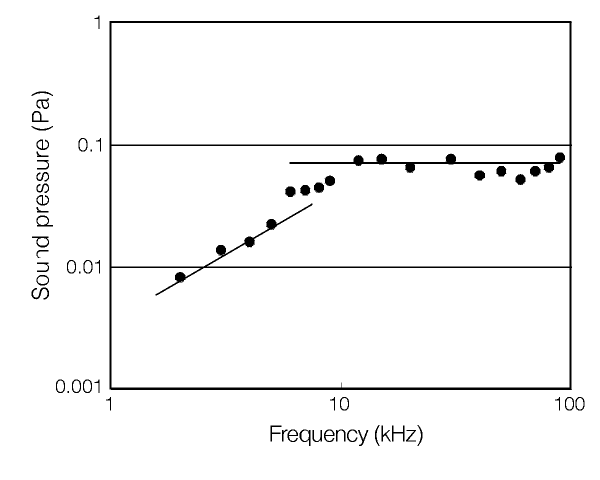
Figure 3 Experimental results. Shown is the measured
acoustic pressure amplitude for the experimental device as a
function of output frequency. The electrical power input was 1 W
cm-2. In the high-frequency range (where the wavelength
is smaller than the device size), the sound pressure is independent
of frequency, as predicted by theory.